Visual Inspection Guide
Visual inspection is a critical step in spectroscopic analysis. While automated pipelines can extract spectra and fit redshifts, human eyes are essential for quality assessment, identifying subtle features, and catching errors that algorithms might miss.
Why We Inspect#
The automated redshift fitting pipeline provides a starting point, but human inspection is necessary to:
- Validate redshift measurements - Confirm that the automated fit is correct
- Identify spectral features - Note which features (emission lines, breaks, continuum) were used
- Flag data quality issues - Mark contamination, chip gaps, or other problems
- Classify object types - Identify AGN, LAEs, quiescent galaxies, and other categories
- Build team consensus - Create a reliable catalog through systematic review
The Inspection Workflow#
- Navigate to a spectrum - Use the spectra table to find objects needing inspection
- Review all available data - Check the 1D/2D spectra, redshift fits, and photometry
- Assess the redshift - Determine your confidence in the redshift measurement
- Tag relevant features and flags - Document what you observed
- Save your inspection - Your assessment is recorded with your name and timestamp
- Add comments if needed - Use the discussion section for notes or questions
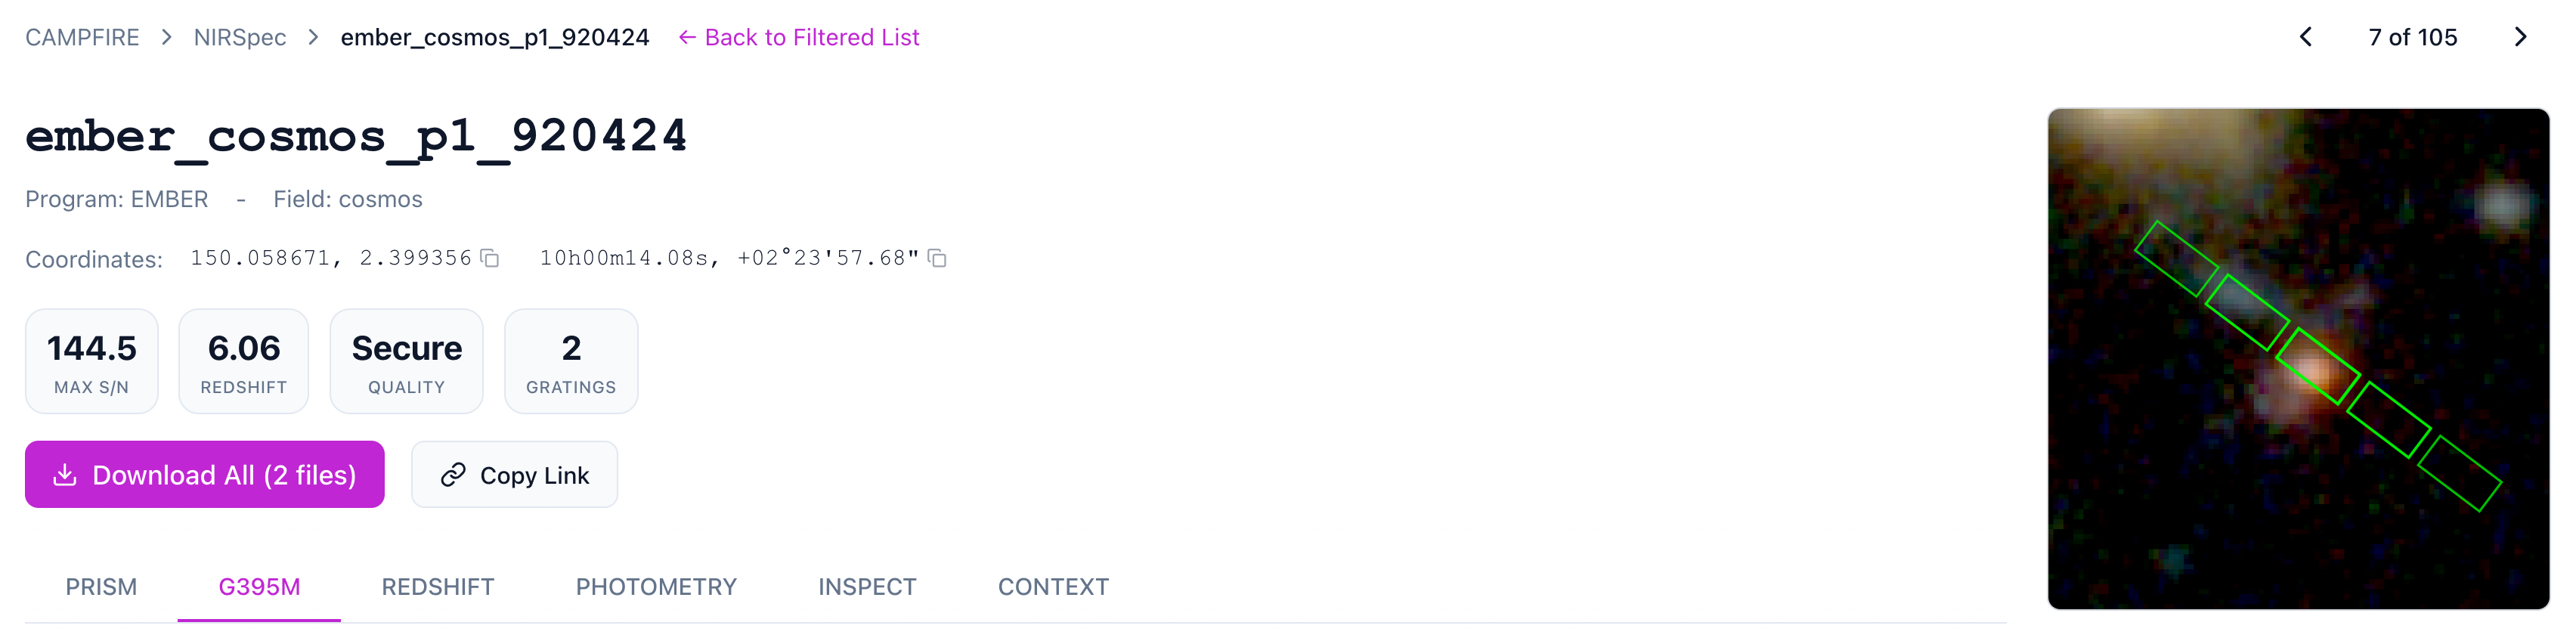
Interface Overview#
The spectrum detail page has six tabs:
| Tab | Purpose |
|---|---|
| PRISM / G140M / G235M / G395M | View 1D and 2D spectra for each grating |
| REDSHIFT | Review the automated redshift fits and chi-squared curves |
| PHOTOMETRY | View the SED fit (if available) |
| INSPECT | Set redshift quality, tag features, and classify the object |
| CONTEXT | Find nearby objects within 1 arcminute |
The Inspect Panel#
The Inspect tab contains the main inspection controls:
Redshift Override#
If you disagree with the automated redshift, you can enter a manual override value. Leave this empty to accept the auto-fit value.
Redshift Quality#
This is the most important field. Select your confidence level in the redshift measurement. See Redshift Quality for detailed guidance.
Feature Tagging#
Tag which spectral features informed your redshift assessment. See Spectral Features for definitions.
Flags#
Classify the object type and flag any data quality issues. See Flags for the complete list.
Best Practices#
- Inspect systematically - Work through objects consistently, don't cherry-pick
- Use all available information - Check multiple gratings, the 2D spectrum, and photometry
- Be conservative with quality ratings - When in doubt, use a lower confidence level
- Document your reasoning - Add comments for ambiguous cases
- Ask for second opinions - Use comments to flag objects for team discussion
Keyboard Shortcuts#
The spectrum plots support standard Plotly interactions.
- Scroll to zoom in/out
- Click and drag to pan
- Double-click to reset the view
Next Steps#
- Redshift Quality - Learn the five quality levels
- Spectral Features - What each feature tag means
- Flags - Object types and data quality flags